
It's hard to overestimate the importance of tracking tools for any business. Without customer service metrics and their analysis, companies wouldn't know how to identify problems on their wake and take prompt measures before they impact the business. Those who choose not to bother with them and do business by guess, end up paying too high a price. Our Live Chat Statistics app provides you with a variety of metrics for tracking and analyzing your customer support team workflow and customers activity on your website. Here are just a few of the tasks that the app can help with:
- Evenly distribute the workload among operators;
- Monitor operator performance, find and strengthen weak points to increase support team efficiency;
- Reduce employee turnover by providing bonuses to the most successful agents;
- Detect and fix issues with your website UX (i.e. by tracking customers interaction with your pre-chat and offline forms, what pages are the least popular, on which pages customers ask for your help the most)
In this article, we will focus on the metrics related to a customer support agent workflow.
Metrics overview
Live Chat Statistics metrics highly depend on the chat distribution method used in the account. There are 4 individual methods when each operator automatically receives their own portion of live chats:
- "Random"
- "Round-Robin"
- "Load-Balanced Random"
- "Load-Balanced Round-Robin"
There is also "To All Operators" method, when all currently online operators get the same incoming chats in their apps, but only one of them can accept a chat and start assisting there (see our user manual for more detailed information about the chat distribution methods).
If at some point you switch from an individual method to "To All Operators" (or the other way around), the statistics will start gathering new data and mix them with the old ones. The results may turn out confusing if you select long reporting periods during which both methods have been used.
Metrics related to live chat operators are displayed in the "Agents" tab of the Statistics app. A general description of the tab is provided in the user manual.
Here, we'll look at some of the metrics you may have questions about, help you understand them and explain how to work with them.
Individual chat distribution methods
"Chat calls" means incoming chats assigned and directed to an operator by the system. If you have chat transcripts sending or online viewing enabled in your account, these chats are marked there with the parameter "Assigned operator" placed in the transcript header. Chat calls convert into accepted or missed chats. They don't include unaccepted chats transferred from other operators. Totals of "Chat calls" are the sum of all values of the column.
"Accepted chats" are chats accepted by an agent (automatically, if the option is enabled in the operator's app, or manually by clicking the "Accept" button). They include chats that the agent received and accepted from other agents. This is why the value can be sometimes greater than the number of the agent's chat calls.
"Missed chats" are chats where a visitor and an agent never got connected with each other. In other words, at each moment of the chat session there was only one person in chat. There are two cases when a chat is considered missed:
- an agent clicked "Declined" or "X" and closed the chat;
- an agent clicked "Accept" after the visitor had left.
"Received agents invitations" indicate that there were chats transferred to an operator, or an operator was invited into other operators' chats. If an operator receives a transferred chat that hasn't been yet accepted and closes it without accepting it, the chat will be recorded as missed by the operator whom it originally was directed. If an operator accepts the transferred chat, then it is recorded to the Accepted chats of that operator.
"Acceptance rate" is the ratio of operator's accepted chats to operator's chat calls. If there are more accepted chats than incoming chats, the value will be greater than 100%. If it's less than 100%, it means that the rest of the chats were missed (declined or accepted after the visitor had left) or transferred unaccepted to other operators. In this case they will appear in these operators' "Received agents invitations" column.
"Load rate" is the ratio of operator's chat calls to the "Total" of the "Chat calls" column. It shows what portion of all incoming chats was directed to the operator's live chat app.
"To All Operators" method
With this method, the meaning of some of the metrics or the way they are calculated is a bit different.
The system directs the same incoming chats to all currently online operators (within the account or a department), so "Chat calls" means incoming chats that appear in the operator's live chat app when it's online. Why the statistics doesn't show the same number of chat calls for all operators? It gets clearer if you click on the "Chat calls" cells and have a look at the timeline chart. For example, in the table you see that operator A received 10 incoming chats, operator B received 8 chats. The timeline can show that both operators got 8 same chats, then one operator went offline and the other one continued receiving more chats. Or their shifts overlapped at some point in time, and they received only a certain number of the same chats.
At the bottom of the "Chat calls" column you can see the actual total of incoming chats that your account received. In the "Company" tab, it corresponds to "Visitor-initiated chats". The value of the "Total" is not the sum of the "Chat calls" column values, it's calculated separately, but no operator can have a "Chat calls" value greater than the "Total".
"Accepted chats" means the same as for the other methods - chats accepted by the operator. However, unlike individual chat distribution methods, this metric does not include chats transferred to the operator since they should be accepted before being transferred. Which means that the actual total of chats handled by the operator is the sum of "Accepted chats" and the number of chats received from other operators ("Received agents invitations" column).
The "Missed chats" column is not displayed, because when using "To All Operators" method the system doesn't assign chats to specific operators, and therefore if a chat has been missed, it's missed by everyone. The metric itself is displayed on the company level, you can find it in the "Company" tab, "Visitor-initiated chats" group.
How to make sense of all these numbers?
First, there is one detail that should be mentioned. Our Live Chat Statistics app, unlike various other apps of this type, updates data of the current day in real time and makes it possible to view them using one of the reporting periods that spans the current day ("Today", "This week", "This month", "This year", "All time"). However, in this case you may observe slight discrepancies in the results. This is normal, because the values of different metrics are calculated and recorded at different periods of time: at the beginning, during and at the end of chats. For instance, if a chat started yesterday and ended today, you would see it in "Chat calls" in yesterday's report, but the information about whether the chat was accepted or missed would appear in today's report after the chat has been finished. Please consider periods that don't involve the current day to get the most accurate data on your support agents.
Now, let's take a look at two simple examples, for accounts with "To All Operators" method and for accounts using one of the individual methods.
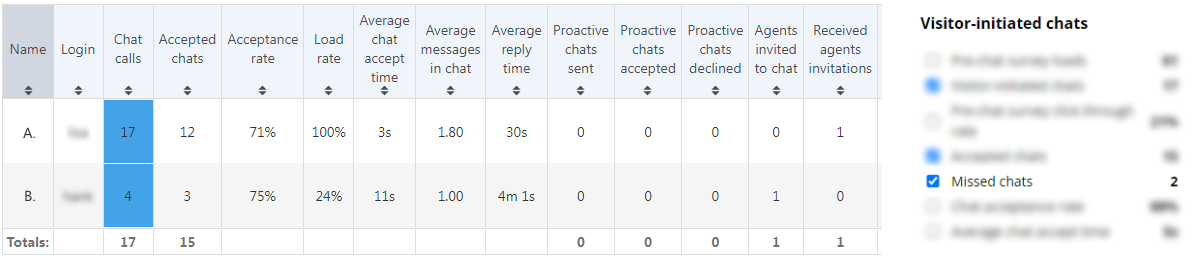
In this table, we see the totals of incoming and accepted chats - 17 and 15, 2 chats are missed, and 1 chat was transferred from one agent to another. Out of 17 incoming chats, agent A got all of them in the app, and agent B got 4. Agent B accepted 3 chats and transferred one of them to agent A. Agent A accepted 12 chats, although they technically could accept 14, because 3 were taken by agent B (17-3). So, we have two missed chats. Who exactly missed them? The chart can shed light upon such situations: whether only one agent was online when these two chats came, or the agents got one chat each on their respective shifts, or they both were online and both missed them.
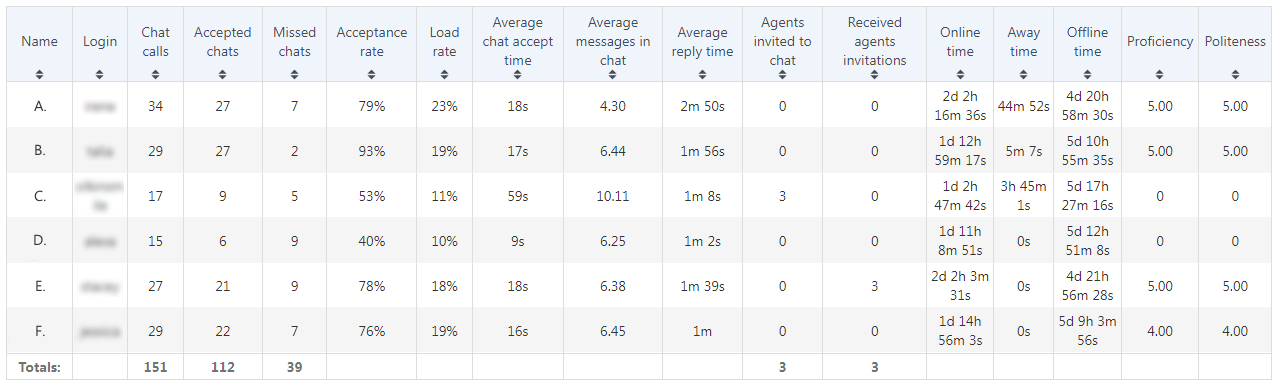
In this table, "Chat calls" totals are the sum of all column values as well as the sum of "Accepted chats" and "Missed chats" totals. All agents, except two, have as many accepted and missed chats as incoming chats. Agent C received 17 incoming chats, accepted 9 chats, missed 5 chats and invited colleagues to 3 chats. 9 and 5 doesn't make 17, so those 3 chats were transferred without being accepted. Agent E received 27 incoming chats, accepted 21 chats, missed 9 chats and got 3 invitations to chats (obviously, from agent C). 21 and 9 make 30, which means that the transferred chats were calculated as accepted for this agent. If they hadn't been accepted by agent E, their "Accepted chats" would've shown 18, and agent C would've had 8 missed chats.
Note: if you ever notice one or some of your support operators are missing from the table, it's not an error, it only means that they were offline during the selected reporting period. Also please be aware that if you change nickname or login of an operator, they will appear in the table as another entry with a new name or login.
Metrics to look out for
- Chat Calls - Allows you to trace on the chart the peak hours of a workday or the busiest periods of the season or the year. It can give you the understanding whether operators' shifts are organized productively enough. Select "Chat calls" cells with the highest values to display them on the chart.
- Acceptance rate (number of accepted chats / number of chat calls of the operator) - Shows how much an operator is involved in chats. If an operator has a low acceptance rate coupled with a high load rate, there might be several reasons to cause this, for example:
- operator has a hard time managing the number of incoming chats. As a result, they might either transfer some of the chats to other operators or ignore new chats for too long while still working in existing ones, until visitors give up waiting and leave;
- in case of "To All Operators" chat distribution method - they are not quick enough to pick chats before other operators do, or they have time consuming and complicated cases in their chats, and they prefer not to accumulate them before finishing the current ones;
- operator gets random chats from people that drop in by mistake, advertisers, abusers or time wasters; to help with this, operators can use the "Block IP" feature in their live chat apps to block persistent chats from such people. In your account Control Panel, you can also block users from specific countries or allow only countries that are in your service area if you don't want contacts from the rest of the world.
- there might be chats initiated by bots; adding "Captcha" to your Pre-Chat survey should fix this (see "How to use Captcha field").
- Load rate (chat calls of an agent / total number of chat calls) - This metric together with Acceptance rate shows if and how often operators are overloaded with chats, or the other way around - if there is a significant underload and operators stay idle for hours. If there is a stable regularity of such imbalances in the agents' workload, it may make sense to think about rearranging their shifts so that there are more agents online during most loaded hours.
- Average chat accept time - This metric is tied up quite closely to customer satisfaction. Ideally, customers expect their chats to be accepted instantly or within a few seconds at least. The lower the number - the less time a customer waits before their problem or inquiry starts to be taken care of, the less frustrated the customer is at the start of chat, the better the chances this customer chooses to do business with your company. Long waiting time is one of the major factors that drive customers off.
- Agents invited to chat (number of chats to which an agent invited other agents) - This metric reveals how often an agent transfers chats to colleagues. Among other reasons, this may mean that customers simply contacted the wrong department, so chats were transferred to the right person. Or maybe the agent is a new employee and has difficulty in handling certain customers' problems and requires additional training.
- Average reply time - Shows how fast an agent sends their reply after they have received a visitor's message. It's calculated based on all agent's responses sent in chats. If it's not due to a technical glitch on the agent's side, high values may indicate that the agent has troubles understanding customer's questions or finding proper solutions fast enough; or they type quite long responses trying to include everything they want to say in one go, or their typing is slow. The exact reason can be revealed by the analysis of the agent's chats (if you have the option of chat transcripts sending or online viewing enabled in your account). A few simple tips may somewhat help in these situations:
- make sure the agent sends a short message to the customer asking to wait for a bit while they check the necessary data;
- divide long texts into smaller parts with two or three sentences to make it all more readable;
- create canned responses for the most frequently used messages to speed up typing.
Tracking Post-chat survey results
Survey results are tracked only when a default survey from our gallery with no customizations is used in the account. Depending on the survey style you set in your account, there are two types of data this metric gives: average rates and total number of cases solved or not solved. Each type uses its own titles for the columns:
- "Proficiency" and "Politeness" - when a survey with a rate selection (from 1 to 5) is set. In this case the statistics app calculates average rates. This metric allows you to track agents with the highest and lowest scores given by customers.
- "Solved cases" and "Not solved cases" - when a survey with a thumb up/thumb down or a smiling/frowny face is set in the account. The total number of solved and not solved cases is calculated.
The comments left by customers are not included - you can find them in the chat transcripts at the bottom ("Post Chat Survey" section). Since the post chat survey can be skipped and there is no way to make it mandatory, not all chats will have ratings. Please bear it in mind when you see that the total number of solved and not solved cases is lower than the number of chats accepted by the agent.
If at any moment you change the survey style to a different type, both types will be presented in the table.
Charts in statistics
Make more use of timeline charts, they illustrate more clearly what you see in the tables and help you understand the numbers. They can help you track changes (progress or regression) of operators' metrics or compare the same metric for different operators during the reporting period.
Data you select in the table can be displayed on the timeline chart by hour, day, week, month or year. We recommend selecting a timespan that is closer to the reporting period, so that the data are readable, or selecting a different reporting period.
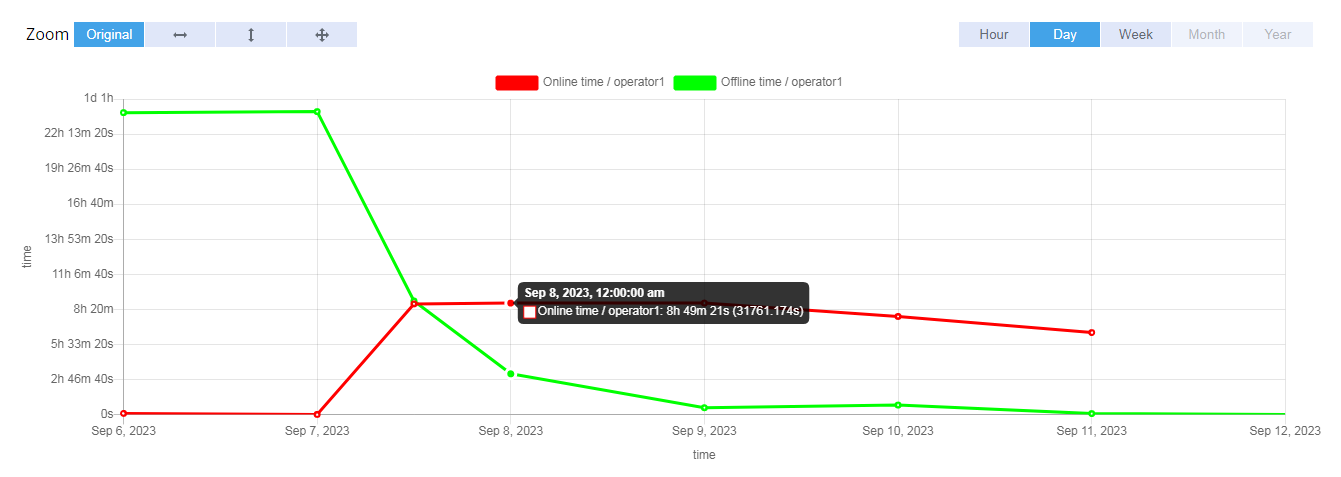
Each selected cell of the table produces its own line on the chart. On the X axis, dots on the lines mark the start of timespans during which the event of the cell happened. If you hover the mouse over a dot, a tiny bubble will appear with details about the event - the start time of the timespan and the duration of the event (or the number of times it happened). The duration of an event is calculated as total during the timespan, so the event (like change of online, away or offline status) may happen once with no breaks or be split into several smaller segments within the timespan that add up to the total duration value. The exact number of such segments is not tracked. For example, at 6:00 on the "Online time" line the bubble shows 27 m, on the "Offline time" line - 33 m accordingly. This means that from 6:00 to 7:00 the operator has been online for 27 minutes and offline for 33 minutes in total. Two scenarios are possible: the operator may have switched from Offline to Online once at 6:33 or have been switching from Offline to Online and back every five minutes.
The Y axis displays different measurements according to the type of the selected cell. The last dot on the chart marks the start of the latest timespan to the end of the selected reporting period.
Although the chart won't show the exact moments in time when and for how long an operator switched online and offline, even with these metrics it can provide you a general idea of the agents' online presence during their shifts, whether they forget to logout after the shifts, or if they misuse the Away mode.
Please remember: no statistics are 100% accurate. It's a good auxiliary tool that complements other means that provide data for your management team to analyze. But we strongly advise not to view it as a self-sufficient and main resource to lean on in your decision making, especially when it comes to serious matters like hiring or firing employees, deciding on salaries, etc.
